
5 signs that your reporting setup is reaching its limits
5 signs that you've outgrown your reporting setup and what you can do about it.
Nobody intentionally designs their financial reporting to be poor.
On the contrary: Most reporting setups in medium-sized businesses are well-conceived and properly built. Someone identifies a problem and wants to solve it, creates an Excel structure, perhaps builds a dashboard, and it runs smoothly for quite some time.
Then the company grows. A new division is added, another upstream system, more people working with the numbers. And at some point, the setup that used to serve us well can no longer handle the new load.
How do you know you've reached this point? And when is it worth letting go of your self-built setup and considering an alternative? Here are 5 signs to look out for.
5 signs that you've outgrown your reporting setup
These signs indicate that your reporting is no longer keeping pace with your business:
1. Only one person understands the file.
There's this one person who knows how the Excel reporting system works. They've built the file over years, know how the many tables and formulas interact, and when it's best to save the file before it crashes again.
As long as she's there, things run relatively smoothly. But when she's on vacation or sick, half the company is waiting for the numbers. And when she resigns, all that knowledge goes with her.
Reporting that depends on a single person is an unnecessary risk. Even if that person is YOU.
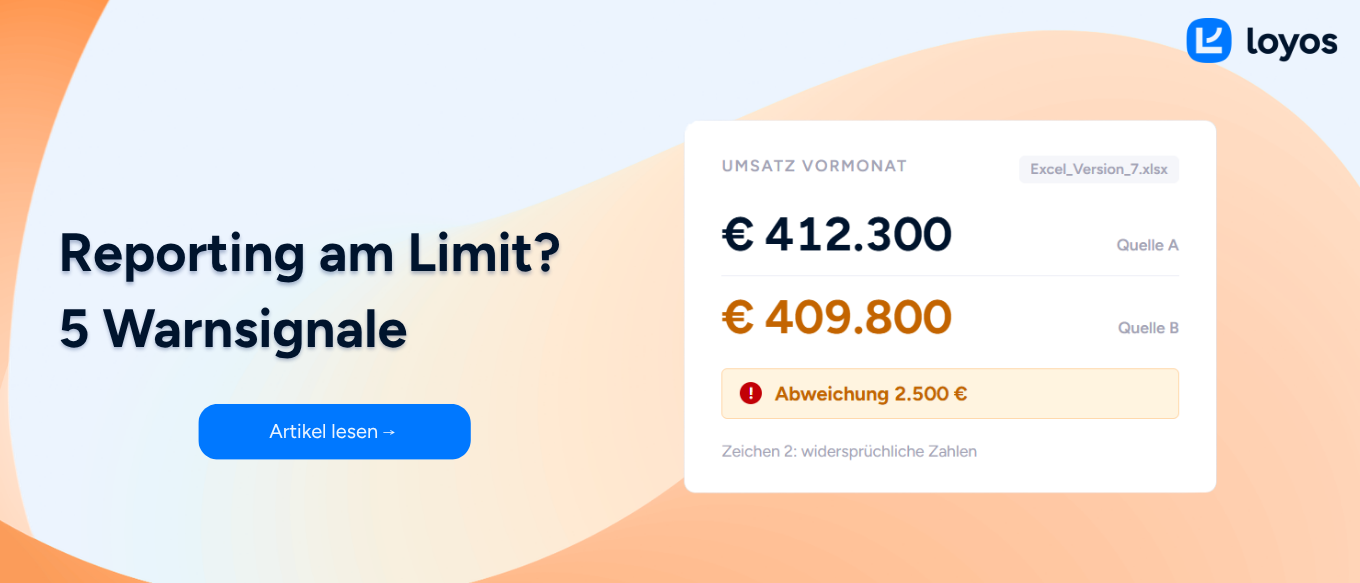
2. The figures contradict each other.
You're preparing the monthly report and pause: the revenue for the previous month differs from what you reported four weeks ago. Uh oh.
There's rarely a major error behind it. More likely, it's an inherent weakness in Excel. Perhaps someone has modified the Excel file, inserted a row, or moved a column, and since then, a formula is calculating with the wrong range. Or there are multiple versions of the same file circulating, and no one knows which is the current one. Or worse still: different people have been working with different versions of the same file. Good luck unraveling that.
In other words: If you no longer blindly trust your own numbers, that's one of the clearest signs that something is wrong with your reporting setup.
3. You see the problem – but not the cause
The margin in one area has plummeted. You can see it in the report. But what's the reason? Is it the price, the costs, or a single large order that's distorting everything?
To find that out, you need to open multiple files, filter them, and compare numbers side by side…
Good reporting, on the other hand, allows you to drill down: it lets you click directly from the unusual number several levels deeper, all the way to the root cause. Without this feature, you're left with only the tedious manual search, which is time-consuming and frustrating.
4. Even a small change becomes a Herculean task.
You want to analyze a new product group separately, see sales by location, or finally get the contribution margin per customer. Sounds like a simple task. In your setup, it takes hours because every change involves a dozen formulas that all need to be updated.
If your reporting penalizes every change, it prevents you from managing your business the way you want. That's a red flag and a clear sign that your reporting setup is no longer suitable.
5. Closing the month is taking up more and more time.
Do you remember how long the month-end closing process took two or three years ago? And how long it takes today?
Your work methods haven't changed much, but everything has increased. Where one data source used to suffice, you now combine several. One location has become two, and with them, significantly more accounts and positions that you have to assign manually. The more data flows through Excel, the greater the risk of errors creeping in, and a small adjustment can suddenly become very time-consuming.
Your reporting is supposed to save you time and give you an overview. Instead, it's taking up precisely the hours you need for the actual analysis of the numbers.
What does reporting that grows with the company look like?
If you recognized yourself in several of the 5 characters, switching to an alternative is the sensible next step. Loyos, for example, approaches it like this:
Our Financial Management Suite connects your existing systems, whether DATEV, SAP, or Sage, and automatically consolidates the figures in one central location. This eliminates the tedious manual collection and copying, ensuring everyone works with the same data from the same source. The question of which file is the correct one is no longer relevant.
If a number stands out, you can drill down directly to the cause. Creating a new view, such as contribution margin per customer or sales by location, takes just a few clicks, instead of rebuilding half the file. And because everyone works with the same data in one place, rather than with a file on a single person's computer, your reporting is no longer dependent on just one individual.
A typical setup is up and running in less than two weeks. And the best part: once it's in use, it delivers reports in minutes that used to take days.
If you like, we can show you what that looks like for a company your size, what it costs, and what you gain from it.
Discover more insights

Build your own Power BI
Your Power BI dashboard looks good, but are the numbers accurate? Pitfalls of building your own and how to avoid them.
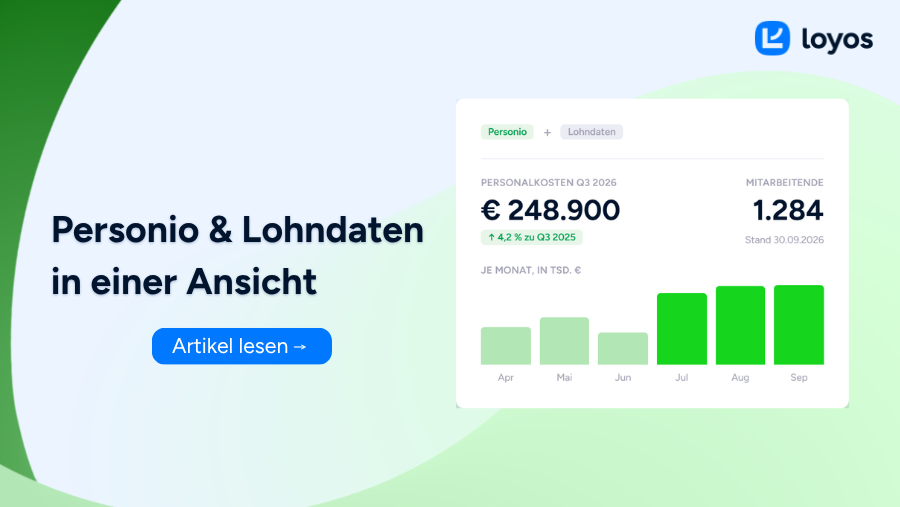
Analyze Personio and payroll data in one view
Personio master data, DATEV/SAP salaries: one view instead of separate evaluation.

These reporting basics will help you increase your selling price.
Selling a company? How good reporting influences the purchase price.